Research that turns into action, not archives.
Upload your reports. Get a living insight graph that builds journey maps, personas, and recommendations automatically, so your team spends time acting on research instead of re-reading it.
Your research repository is a graveyard, not a resource.
Most research tools are built report-first. You upload a study, tag some insights inside it, and move on. Six months later, nobody remembers it exists. The next person with the same question re-reads three old decks instead of getting an answer.
The problem was never tagging. It's architecture. If insights live inside reports, your repository can only ever be as good as someone's memory of what's in there.
We built this differently. The insight is the primary object, not the report. Every report you upload strengthens a single connected graph, where insights get reinforced, contradicted, or connected across every study you've ever run. Reports pile up. Insights compound.
From raw report to actionable synthesis in minutes, not weeks.
Every research team has felt this. The study is done, the interviews are transcribed, and then the real work starts. Synthesizing findings into something a stakeholder can actually use is the part that eats a week.
We collapse it. Upload a report and get atomic insights, evidence-linked back to source, dimension-tagged, and ready to act on. Automatically extracted, not manually assembled.
Stop storing reports. Start building a graph.
Traditional repositories: report in, report sits, tags live inside it, next report starts over.
Ours: report in, atomic insights extracted, each one linked to every other insight it supports, contradicts, or builds on, across every report you've ever uploaded, indefinitely.
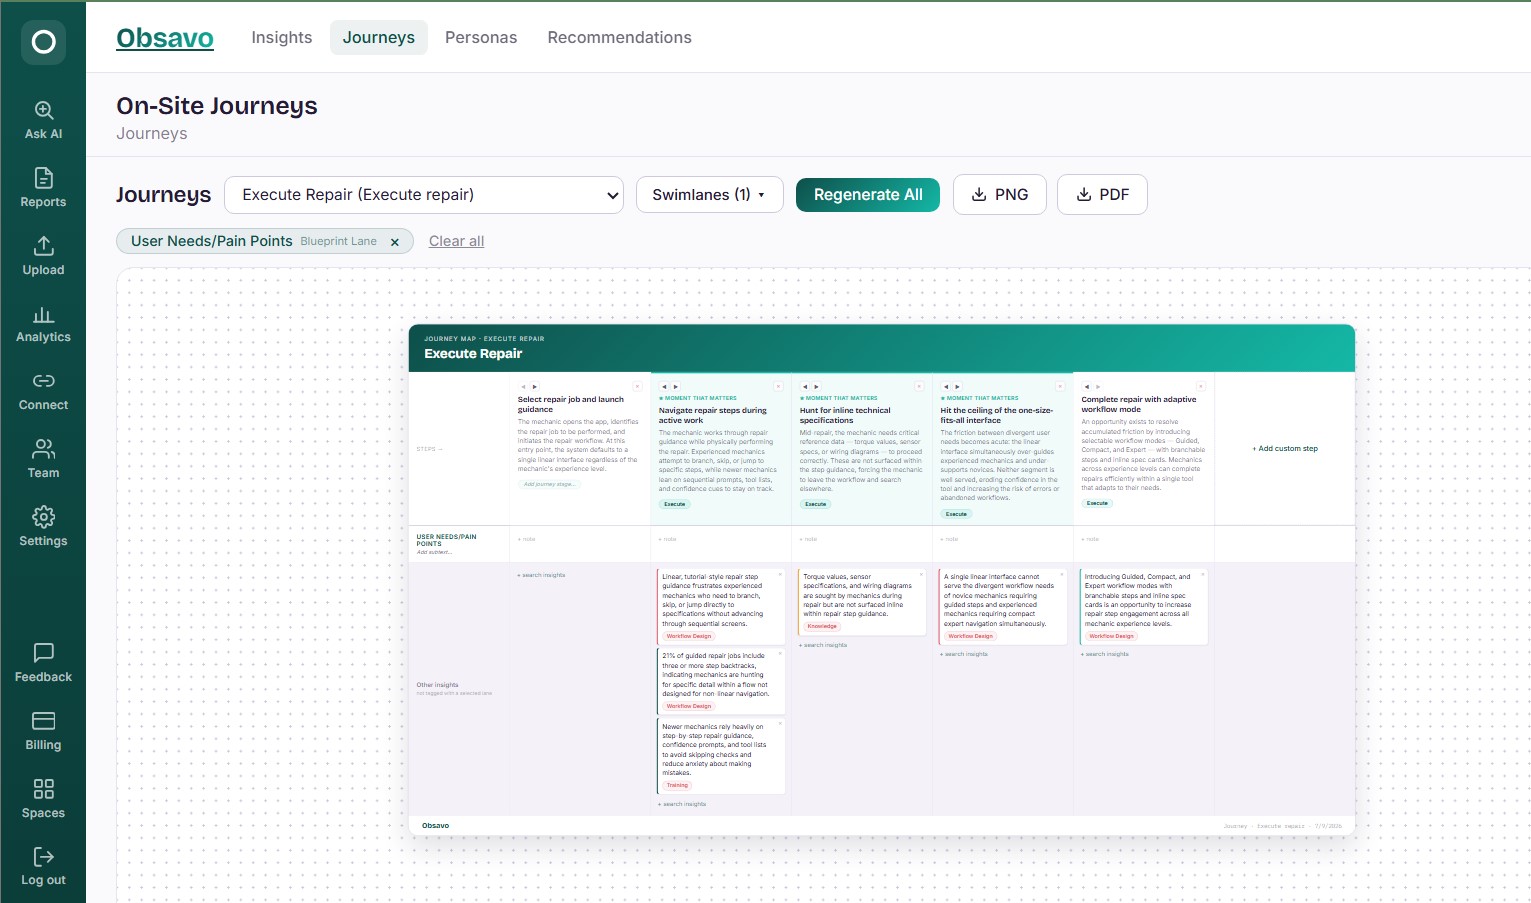
Journey maps that build themselves.
Journey mapping is normally a workshop. Sticky notes, a whiteboard, someone's best guess at stitching together six interviews into one narrative. It's slow, it's subjective, and it goes stale the moment new research lands.
We generate journey maps directly from your insight graph. Every step is populated with real evidence, filterable by segment or team, and updated automatically as new research reinforces or contradicts what's already there.
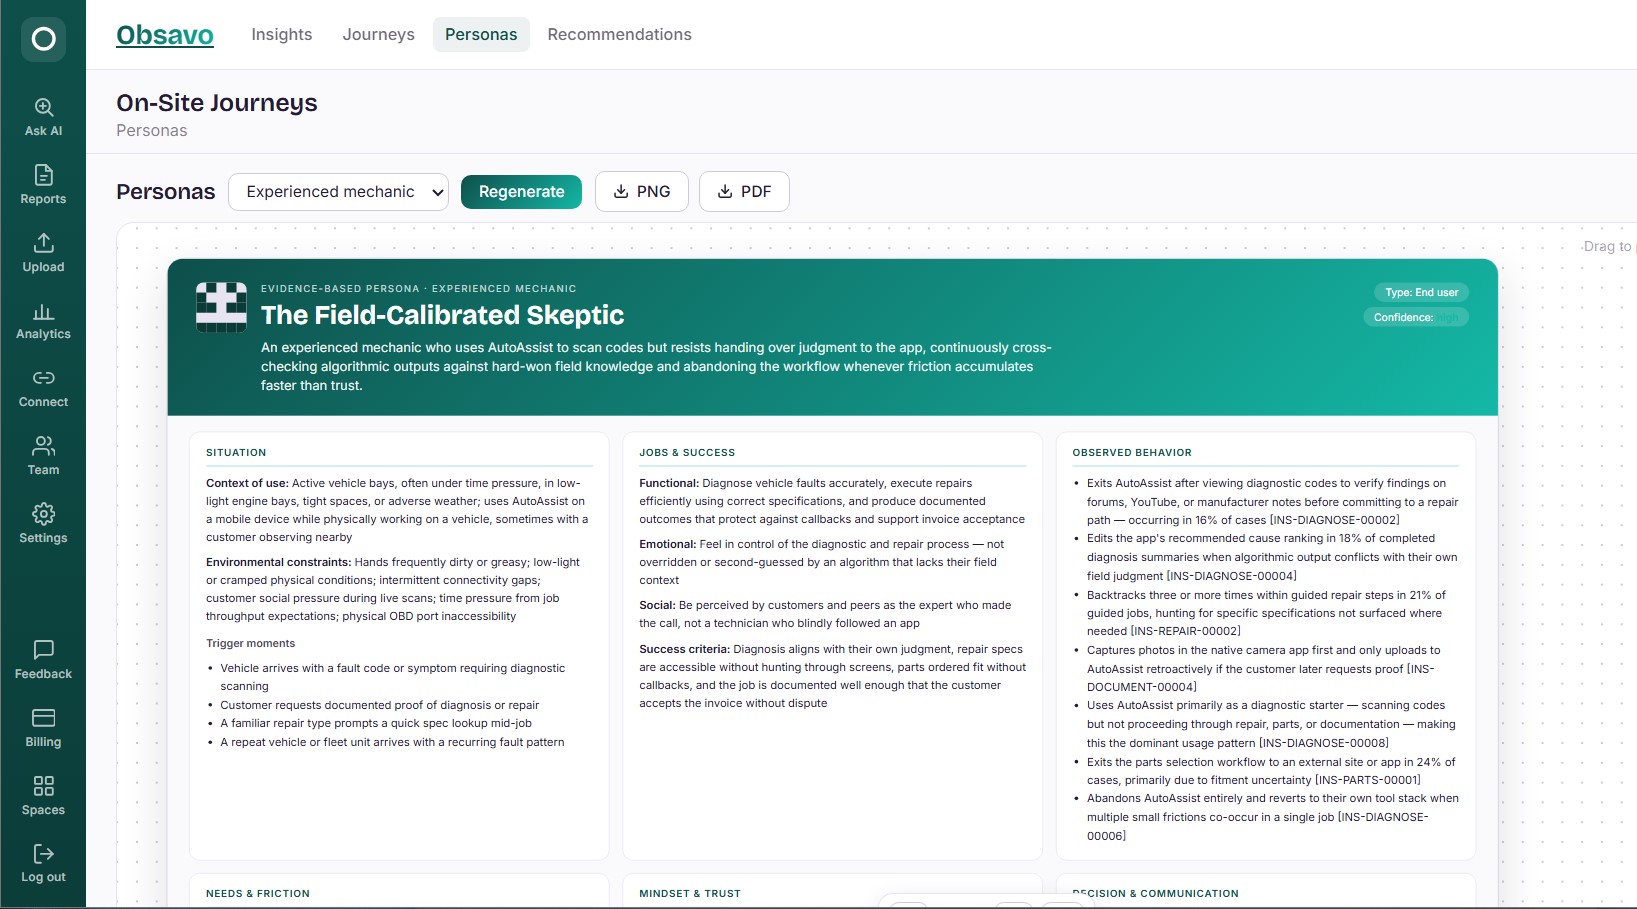
Personas grounded in evidence, not a workshop's best guess.
Personas usually calcify the day they're created. A snapshot of what was true at one meeting, never updated again.
Ours regenerate from live insight data. Every persona narrative is built from the actual evidence behind it, with inline references back to the insights that inform it, plus a one-click regenerate whenever the graph learns something new.
Your analytics and your interviews, finally speaking the same language.
Everywhere else, qualitative and quantitative research live in different tools, different formats, different conversations. A researcher has to manually connect "conversions dropped 23%" to "users told us the CRM step was confusing." That connective work rarely happens, and when it does, it's ad hoc.
We treat both as the same kind of evidence. Drop in a GA4 export or a suggestion-box spreadsheet alongside your interview reports, and get a single unified insight graph. Statistical anomalies and qualitative findings, evidence-linked side by side, not siloed in separate tools.
Who this is for
Startup research teams
One or two researchers, no dedicated ResearchOps, no time to manually build a journey map after every study. Get synthesis-grade output without the synthesis-grade headcount.
Mid-size research teams
Enough volume that "ask the researcher who remembers" stops scaling. Every stakeholder question gets the same synthesized, evidence-backed answer, not one person's personal recall of six months of studies.
Growing research functions
Teams evaluating whether to formalize a repository for the first time, who don't want to inherit the report-first sprawl that made the old tools go stale in the first place.
Most repositories help you store research. We help you act on it.
| Traditional repository | Obsavo | |
|---|---|---|
| Core object | The report | The insight |
| Cross-report patterns | Manual, if it happens at all | Automatic, structural |
| Journey maps | Built by hand in a workshop | Generated from the graph |
| Personas | Static, created once | Live, regenerate on demand |
| Qual + quant | Separate tools | One pipeline |
| Value on day one | Only after months of tagging | Immediate on first upload |